Three national libraries have each uploaded tens of thousands of public-domain images to Wikimedia Commons. We built two large, original datasets on the same images to ask three questions in turn: what gets opened, where it travels, and what generative AI does to its value.
What's opened
Provision · three strategies
Where it travels
Diffusion · 161k reuses
Value in the AI era
Stock or prompt
What we study
The same heritage image can be given away for free on Wikimedia, listed for sale on a stock site or print shop, and placed in a news article or a social media post, all at once. We follow each uploaded image across the open web to see where it goes and what it is worth.
Open by Design: open distribution as a strategic choice
From the outside, uploading public-domain images looks like one good deed. We compare the complete file-level metadata of the three libraries' Wikimedia Commons categories, 168,030 files in total: volume and timing, file size and pixel count, file format, the age of the underlying works, rights labels, descriptive metadata, and who does the uploading. Three distinct strategies appear.
British Library
Decentralised, mass release. 90,281 files, concentrated in two release episodes (2014 and 2018); small JPEG files; mixed rights labels (40 % explicit public domain, 48 % “no known restrictions”); 51.5 % templated English-only descriptions; uploaded mainly by 576 volunteer accounts.
Koninklijke Bibliotheek
Curator-led. 30,849 files in a moderate, steady flow; JPEG files of its oldest holdings (median creation year 1662); 98 % public domain; object-level bilingual descriptions; uploaded by a small number of staff accounts (top three: 91 %).
Swiss National Library
Centralised, institutional. 46,900 files, recent and accelerating (largest year 2024); very large TIFF files (median 69.8 MB, 35 megapixels; downsized derivatives of its production files); 99.5 % public domain; short multilingual descriptions with a named creator on 95 %; 97 % through a single official account.
The typology is descriptive and does not rank the three approaches. Each reflects the institution's mandate, resources and objectives.
A model of open distribution: five questions the institution controls
Cultural value resides in the collections. Open provision determines under which conditions the digital copies become available beyond the institution's own systems. Diffusion follows, and social value is only realised when the material is actually used. Provision is the part of this chain that the institution controls, and each choice involves a trade-off.
Distribution is a strategic decision, not a technical afterthought. The same act of putting collections online creates very different conditions for diffusion depending on format, rights labels and metadata practice. Institutions that inherit these parameters as defaults, from a vendor, a legacy release or a volunteer community, give up control over them.
Keep rights and provenance metadata in-house. Volunteer provision delivers scale and engagement at low marginal cost, but it disperses responsibility for certain fields.
Match the metrics to the strategy. Where preservation is the aim, technical choices and detailed metadata are the appropriate measures; where access is the aim, reach and diffusion are. A single diffusion metric would penalise the preservation mandate that is part of a national library's mission.
Open distribution adds resilience. When the British Library's own systems were down after the 2023 cyber-attack, the copies on Flickr and Wikimedia Commons remained available.
From Digitization to Diffusion: where open heritage travels
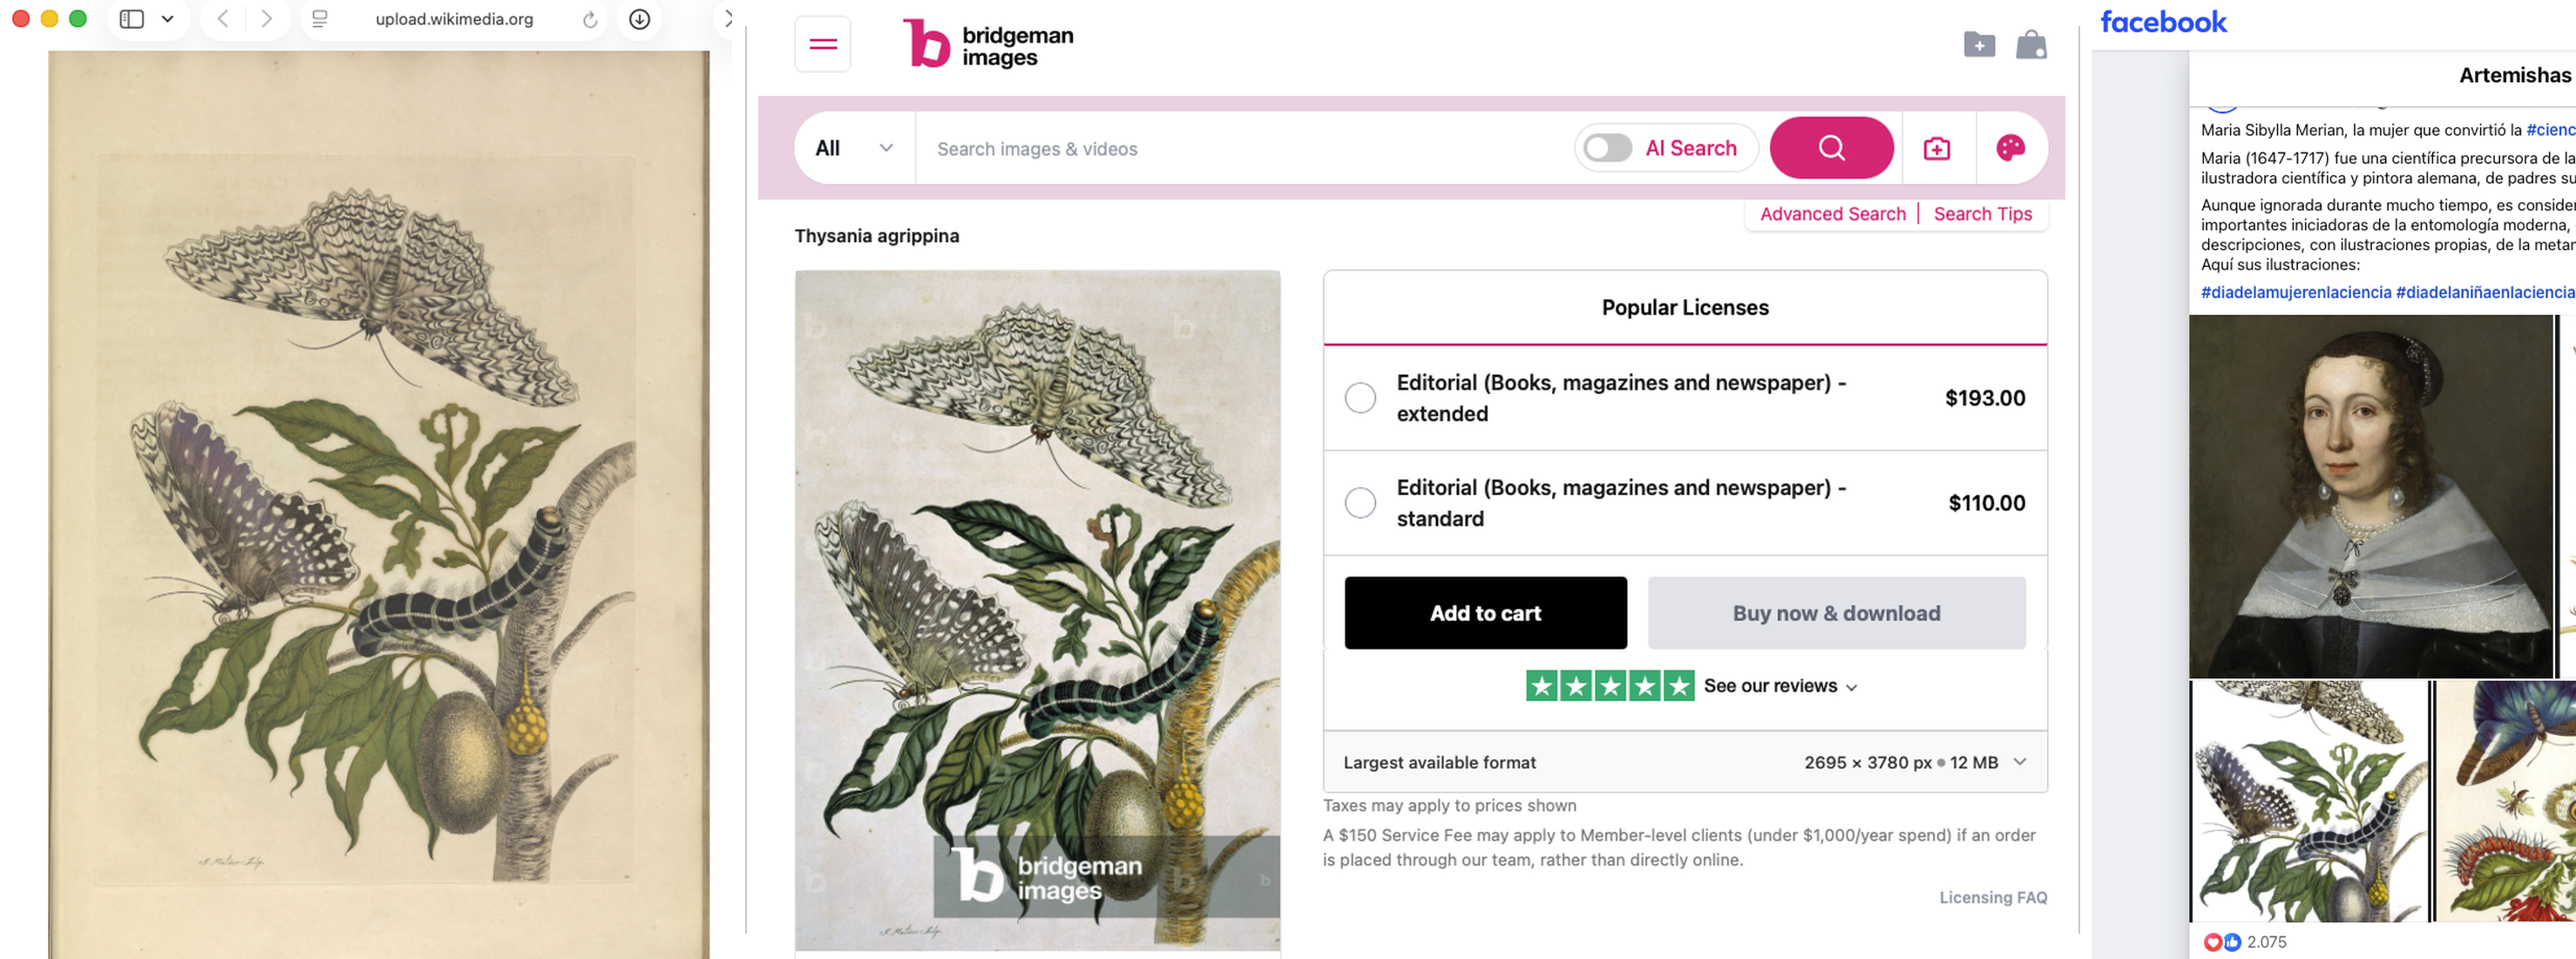
We drew a random sample of 5,000 images per library, ran each through reverse-image search and found them again 161,367 times: on stock image platforms, in news articles, blogs and Wikipedia pages, on social media and in print-on-demand shops. 61 percent of images are reused at least once, most often on stock image platforms, and most reuse we can locate sits outside the library's own country.
Colour intensity = located reuses in that country, inferred from the top-level domain of the reuse website (this locates the website, not the user). Reuses on generic domains such as .com carry no country information and are not shown. The pattern centres on Europe; the Swiss National Library peaks at home, the KB in the Netherlands, while the British Library reaches further into English-speaking countries.
Three kinds of reuse
What goes with reuse (image-level analysis, holding content type and library constant)
Logit and count models with content-type indicators and national-library fixed effects. Bar widths indicate relative strength, not exact odds; only “years online” is quantified precisely. Upload characteristics are institutional choices, so all estimates are conditional correlations rather than causal effects. Public-domain status holds in every robustness check; the format result weakens once the creation cohort is held fixed.
Reuse since generative AI entered the image market
Our observation window spans the release of the first large text-to-image tools and ChatGPT in late 2022. Among the 18,641 reuses we can date, social media reuse rises from 311 in 2018 to 1,482 in 2025, and its share from 17 to 43 percent. Appearances on stock platform domains move the other way, from 438 to 59, and from a quarter of dated reuses to under 2 percent. News reuse is flat at about 200 dated reuses a year. The chart holds the set of images fixed, following only the 5,541 sampled images uploaded by 2017.
Dated reuses per image, fixed set of images uploaded by 2017, 2018–2025. “Stock platform” covers the domains of large stock platforms; “all other domains” covers every other reuse site. The 2022 value on other domains includes a single free clipart aggregator. Values read from the paper's figure. Only 16 percent of detected reuses carry a date, and reuse on stock platforms was already falling from 2019, so we read this as a description of how the composition of reuse shifted rather than as an estimate of its cause.
What is this open heritage worth?
Following Heald et al. (2015) and Erickson et al. (2018), we value observed reuses at commercial licensing prices, USD 150 for a low-resolution and USD 350 for a high-resolution standard Getty Images licence. The result measures the licensing cost that reusers avoided. It is an upper bound, since at a positive price most of the observed uses would not take place. We apply it separately to the two kinds of reuse.
Scaled to all images each library has uploaded. Applied reuse comes closer to a consumer surplus measure, since a news article or a wiki page needs an image and the reuser would otherwise license one or produce one: roughly USD 31–73 million for the British Library, 9–22 million for the Koninklijke Bibliotheek and 2–6 million for the Swiss National Library. Listings can only be valued under an assumption about sales, which we do not observe: if every commercial appearance led to a licensed sale, USD 129–301 million; if one in a hundred did, 1–3 million; one in a thousand, under half a million. These figures rest on one licence price, leave out what we cannot see (print, teaching, paywalls, closed platforms, AI training) and say nothing about whether users would have bought a licence at all.